This page was generated from water_quality.ipynb.
Interactive online version:
![]()
Water Quality Portal#
[1]:
from __future__ import annotations

import contextily as ctx
import geopandas as gpd
import matplotlib.pyplot as plt
from shapely.geometry import Point

from pygeohydro import WaterQuality
The WaterQuality has a number of convenience methods to retrieve data from the web service. Since there are many parameter combinations that can be used to retrieve data, a general method is provided to retrieve data from any of the valid endpoints. You can use get_json to retrieve stations info as a geopandas.GeoDataFrame or get_csv to retrieve stations data as a pandas.DataFrame. You can construct a dictionary of the parameters and pass it to one of these functions. For
more information on the parameters, please consult the Water Quality Data documentation. For example, let’s find all the stations within a bounding box that have Caffeine data:
[2]:
wq = WaterQuality()
stations = wq.station_bybbox((-92.8, 44.2, -88.9, 46.0), {"characteristicName": "Caffeine"})
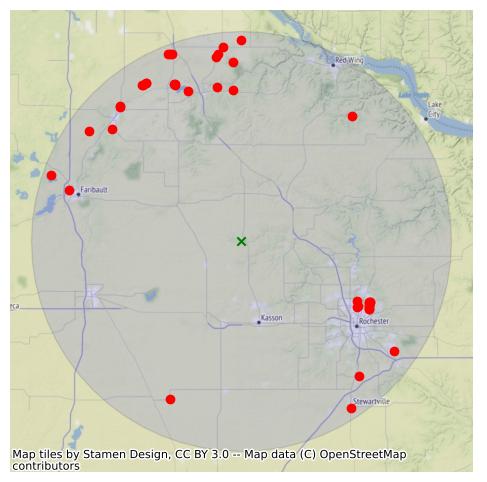
Or the same criterion but within a 30 mile radius of a point:
[3]:
stations = wq.station_bydistance(-92.8, 44.2, 30, {"characteristicName": "Caffeine"})
[4]:
point = gpd.GeoSeries([Point(-92.8, 44.2)], crs="epsg:4326")
point = point.to_crs(point.estimate_utm_crs())
buff = point.buffer(30 * 1609.344)

fig, ax = plt.subplots(figsize=(6, 6))
buff.plot(ax=ax, facecolor="b", edgecolor="black", alpha=0.1)
point.plot(ax=ax, color="g", marker="x")
stations.to_crs(buff.crs).plot(ax=ax, color="r", marker="o")
ctx.add_basemap(ax, crs=buff.crs)
ax.set_axis_off()
ax.margins(0)
fig.savefig("_static/water_quality.png")
Then we can get for al these stations the data like this:
[5]:
sids = stations.MonitoringLocationIdentifier.tolist()
caff = wq.data_bystation(sids, {"characteristicName": "Caffeine"})
caff.head()
[5]:
| OrganizationIdentifier | OrganizationFormalName | ActivityIdentifier | ActivityTypeCode | ActivityMediaName | ActivityMediaSubdivisionName | ActivityStartDate | ActivityStartTime/Time | ActivityStartTime/TimeZoneCode | ActivityEndDate | ... | ResultAnalyticalMethod/MethodName | MethodDescriptionText | LaboratoryName | AnalysisStartDate | ResultLaboratoryCommentText | DetectionQuantitationLimitTypeName | DetectionQuantitationLimitMeasure/MeasureValue | DetectionQuantitationLimitMeasure/MeasureUnitCode | PreparationStartDate | ProviderName | |
|---|---|---|---|---|---|---|---|---|---|---|---|---|---|---|---|---|---|---|---|---|---|
| 0 | USGS-MN | USGS Minnesota Water Science Center | nwismn.01.00400395 | Sample-Routine | Water | Surface Water | 2004-09-03 | 11:30:00 | CDT | NaN | ... | NWQL Schedule 1433 | USGS WRI 01-4186 | NaN | 2004-11-13 | NaN | Estimated Detection Level | 0.50 | ug/l | 2004-09-16 | NWIS |
| 1 | USGS-IA | USGS Iowa Water Science Center | nwisia.01.00700543 | Sample-Routine | Water | Groundwater | 2007-08-27 | 15:00:00 | CDT | NaN | ... | Pest, polar, wf, spe, HPLC-MS | USGS WRI 01-4134 | USGS-National Water Quality Lab, Denver, CO | 2007-09-12 | NaN | Laboratory Reporting Level | 0.04 | ug/l | 2007-09-04 | NWIS |
| 2 | USGS-MN | USGS Minnesota Water Science Center | nwismn.01.00800189 | Sample-Routine | Water | Groundwater | 2008-04-23 | 12:30:00 | CDT | NaN | ... | NWQL Schedule 4433 | USGS TMR 5-B4 | USGS-National Water Quality Lab, Denver, CO | 2008-05-23 | NaN | Estimated Detection Level | 0.20 | ug/l | 2008-05-08 | NWIS |
| 3 | USGS-MN | USGS Minnesota Water Science Center | nwismn.01.00800166 | Sample-Routine | Water | Groundwater | 2008-04-23 | 13:53:00 | CDT | NaN | ... | NWQL Schedule 4433 | USGS TMR 5-B4 | USGS-National Water Quality Lab, Denver, CO | 2008-05-26 | NaN | Estimated Detection Level | 0.20 | ug/l | 2008-05-08 | NWIS |
| 4 | USGS-MN | USGS Minnesota Water Science Center | nwismn.01.00800206 | Sample-Routine | Water | Groundwater | 2008-04-23 | 13:30:00 | CDT | NaN | ... | NWQL Schedule 4433 | USGS TMR 5-B4 | USGS-National Water Quality Lab, Denver, CO | 2008-05-23 | NaN | Estimated Detection Level | 0.20 | ug/l | 2008-05-08 | NWIS |
5 rows × 63 columns