This page was generated from ssebop.ipynb.
Interactive online version:
![]()
Actual Evapotranspiration#
[1]:
from __future__ import annotations

from pathlib import Path

import networkx as nx
import osmnx as ox
import pandas as pd

import pygeohydro as gh
from pynhd import NLDI
The daily actual evapotranspiration can be retrieved from SEEBop database. Note that since this service does not offer a web service and data are available as raster files on the server, so this function is not as fast as other functions and download speed might be the bottleneck.
You can get the actual ET for position-based requests using ssebopeta_bycoords and for geometry-based requests using ssebopeta_bygeom.
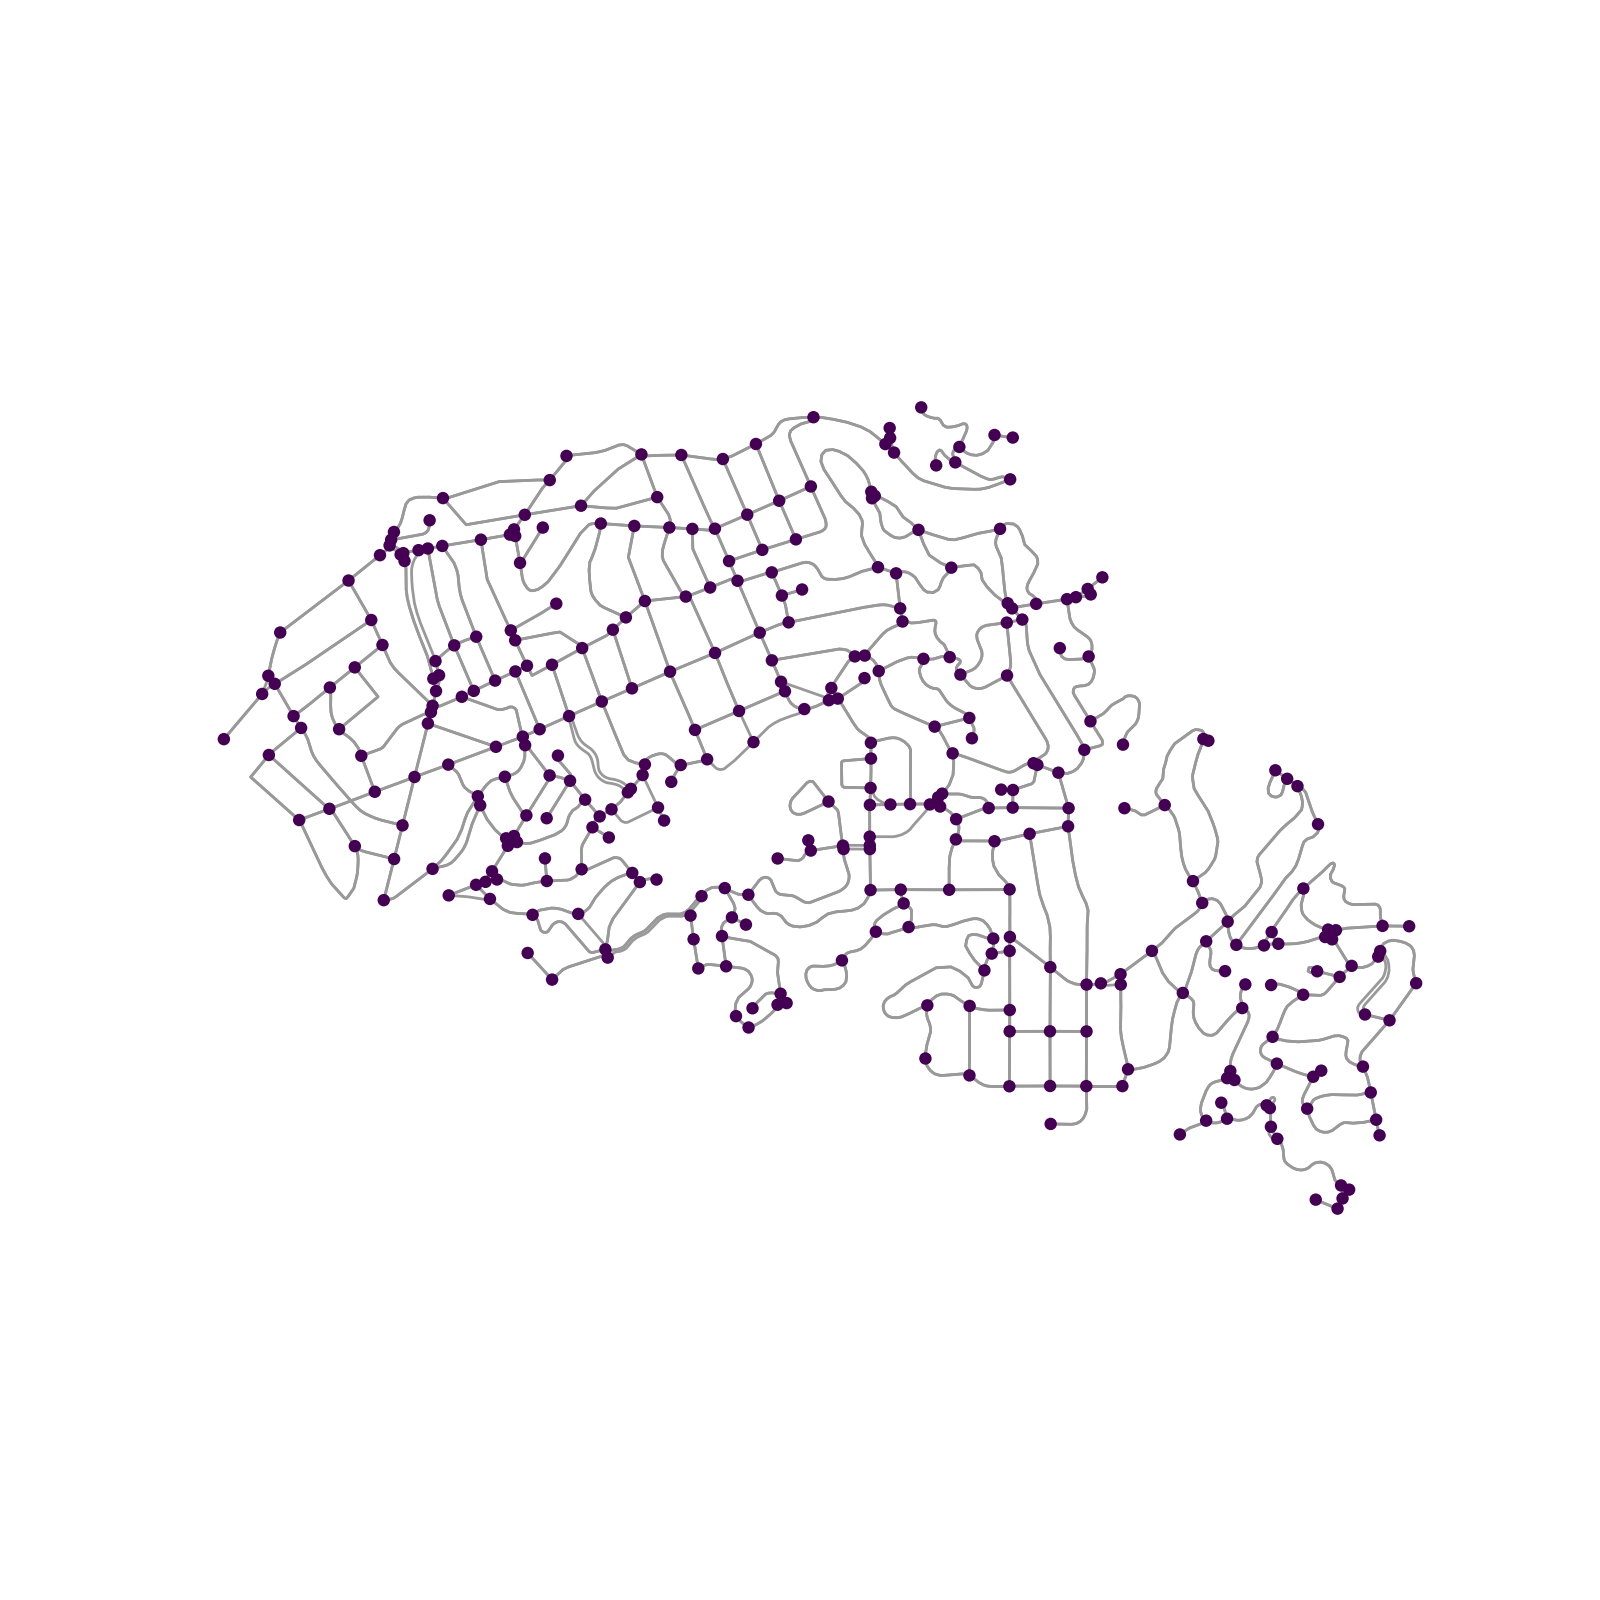
Now, let’s see ssebopeta_bycoords in action. The coordinates must be a dataframe with three columns: id, x, and y. Let’s use osmnx package to get a street network:
[2]:
G = ox.graph_from_place("Piedmont, California, USA", network_type="drive")
Now, we can get land cover and tree canopy for each node based on their coordinates and then plot the results.
[3]:
dates = ("2005-10-01", "2005-10-05")
x, y = nx.get_node_attributes(G, "x"), nx.get_node_attributes(G, "y")
coords = pd.DataFrame({"id": x.keys(), "x": x.values(), "y": y.values()})
ds = gh.ssebopeta_bycoords(coords, dates=dates)
The function returns a xarray.Dataset:
[4]:
ds
[4]:
<xarray.Dataset> Size: 23kB
Dimensions:      (time: 5, location_id: 353)
Coordinates:
  * time         (time) datetime64[ns] 40B 2005-10-01 2005-10-02 ... 2005-10-05
  * location_id  (location_id) int64 3kB 53017091 53018397 ... 11036463561
Data variables:
    eta          (time, location_id) float64 14kB 0.0 0.0 0.0 ... 0.0 0.0 0.0
    x            (location_id) float64 3kB -122.2 -122.2 ... -122.2 -122.2
y (location_id) float64 3kB 37.83 37.82 37.82 ... 37.82 37.83Let’s add the average value of obtained ETAs to the street nodes:
[5]:
eta_m = ds.mean(dim="time").eta
eta_dict = {sid: eta_m.sel(location_id=sid).item() for sid in eta_m.location_id.values}
nx.set_node_attributes(G, eta_dict, "eta")
[6]:
nc = ox.plot.get_node_colors_by_attr(G, "eta", cmap="viridis")
fig, ax = ox.plot_graph(
    G,
    node_color=nc,
    node_size=20,
    save=True,
    bgcolor="w",
)
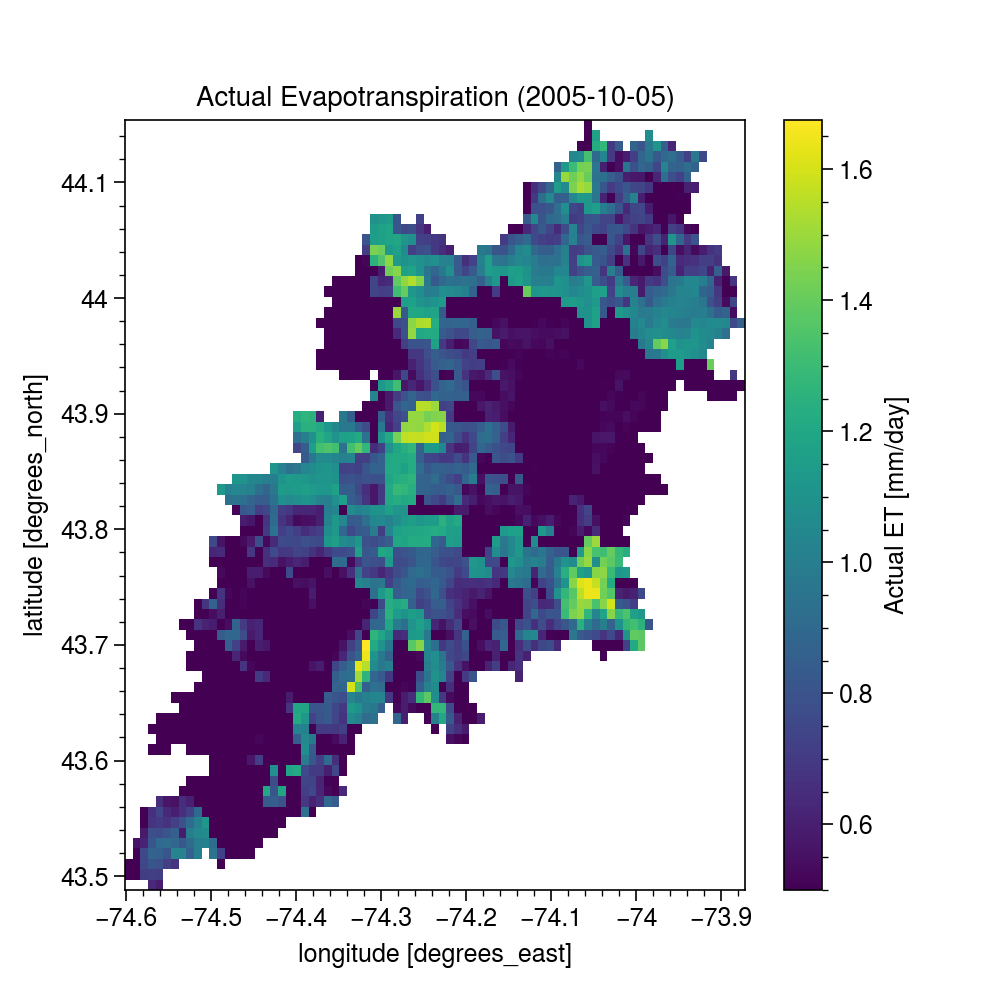
Now, we get a watershed geometry using NLDI and then get the actual ET within its geometry.
[7]:
geometry = NLDI().get_basins("01315500").geometry.iloc[0]
[8]:
eta = gh.ssebopeta_bygeom(geometry, dates=dates)
[9]:
ax = eta.isel(time=4).plot(size=5)
date = eta.isel(time=4).time.dt.strftime("%Y-%m-%d").values
ax.axes.set_title(f"Actual Evapotranspiration ({date})")
ax.figure.savefig("_static/eta.png", bbox_inches="tight", facecolor="w")
ax.figure.savefig(Path("_static", "ssebop.png"), dpi=300, bbox_inches="tight", facecolor="w")