This page was generated from 3dep.ipynb.
Interactive online version:
![]()
Topographic Data#
[1]:
from __future__ import annotations

from pathlib import Path

import matplotlib.pyplot as plt
import networkx as nx
import numpy as np
import osmnx as ox
import osmnx.plot as ox_plot
import xarray as xr
import xrspatial

import py3dep
import pydaymet as daymet
from pynhd import NLDI
Py3DEP provides access to the 3DEP database which is a part of the National Map services. The 3DEP service has multi-resolution sources and depending on the user provided resolution, the data is resampled on the server-side based on all the available data sources.
The following functionalities are currently available:
get_map: Get topographic data the dynamic 3DEP service that supports the following layers:DEM
Hillshade Gray
Aspect Degrees
Aspect Map
GreyHillshade Elevation Fill
Hillshade Multidirectional
Slope Degrees
Slope Map
Hillshade Elevation Tinted
Height Ellipsoidal
Contour 25
Contour Smoothed 25
get_dem: Get DEM data from either the dynamic or static 3DEP service. Considering that the static service is much faster, if the target DEM resolution is 10 m, 30 m, or 60 m, then the static service is used. Otherwise, the dynamic service is used.static_3dep_dem: Get DEM data at 10 m, 30 m, or 60 m resolution from the staged 3DEP data. Since this function only returns DEM, for computing other terrain attributes you can use xarray-spatial. Just note that you should reproject the outputDataArrayto a projected CRS like 5070 before passing it toxarray-spatiallike so:dem = dem.rio.reproject(5070).elevation_bygrid: For retrieving elevations of all the grid points in a 2D grid.elevation_bycoords: For retrieving elevation of a list ofxandycoordinates.elevation_profile: For retrieving elevation profile along a line at a given spacing. This function converts the line to a B-spline and then calculates the elevation along the spline at a given uniform spacing.deg2mpm: For converting slope dataset from degree to meter per meter.query_3dep_sources: For querying bounds of 3DEP’s data sources within a bounding box.check_3dep_availability: For querying 3DEP’s resolution availability within a bounding box.
Let’s get a watershed geometry using NLDI and then get DEM and slope at 90 m resolution.
[2]:
geometry = NLDI().get_basins("11092450").geometry.iloc[0]
We can either directly use get_map to get DEM and slope or use get_dem to get DEM and then use xarray-spatial to compute slope.
[3]:
topo = py3dep.get_map(["DEM", "Slope Degrees"], geometry, 90, geo_crs=4326, crs=5070)
[4]:
dem = py3dep.get_dem(geometry, 30)
dem = dem.rio.reproject(5070)
slope = py3dep.deg2mpm(xrspatial.slope(dem))
topo = xr.merge([dem, slope])
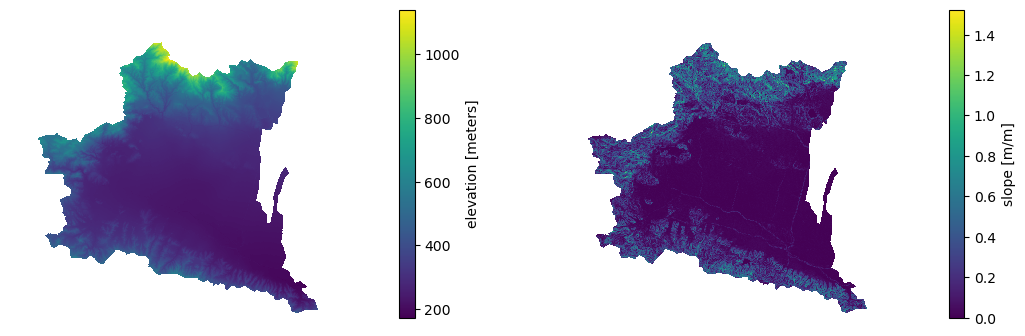
We can save the DEM DataArray as a raster file using rioxarray:
[5]:
dem.rio.to_raster(Path("input_data", "dem_11092450.tif"))
[6]:
fig, axs = plt.subplots(ncols=2, figsize=(13, 4))
dem.plot(ax=axs[0])
slope.plot(ax=axs[1])
for ax in axs:
    ax.set_title("")
    ax.set_axis_off()
fig.savefig("_static/dem_slope.png", bbox_inches="tight", facecolor="w")
We can also get elevations of a list of coordinates using py3dep.elevation_bycoords function. This function is particularly useful for getting elevations of nodes of a network, for example, is a river or a street network. Let’s use osmnx package to get a street network:
[7]:
G = ox.graph_from_place("Piedmont, California, USA", network_type="drive")
Now, we can get the elevations for each node based on their coordinates and then plot the results.
[ ]:
x, y = nx.get_node_attributes(G, "x").values(), nx.get_node_attributes(G, "y").values()
elevation = py3dep.elevation_bycoords(list(zip(x, y)), crs=4326)
nx.set_node_attributes(G, dict(zip(G.nodes(), elevation)), "elevation")
[9]:
nc = ox_plot.get_node_colors_by_attr(G, "elevation", cmap="terrain")
fig, ax = ox.plot_graph(
    G,
    node_color=nc,
    node_size=10,
    save=True,
    bgcolor="w",
    filepath="_static/street_elev.png",
    dpi=100,
)
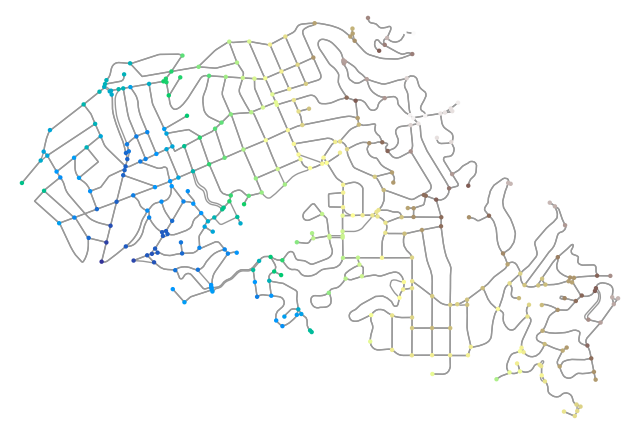
Note that, this function gets the elevation data from the elevation map of the bounding box of all the coordinates. So, if the larger the extent of this bounding box, the longer is going to take for the function to get the data.
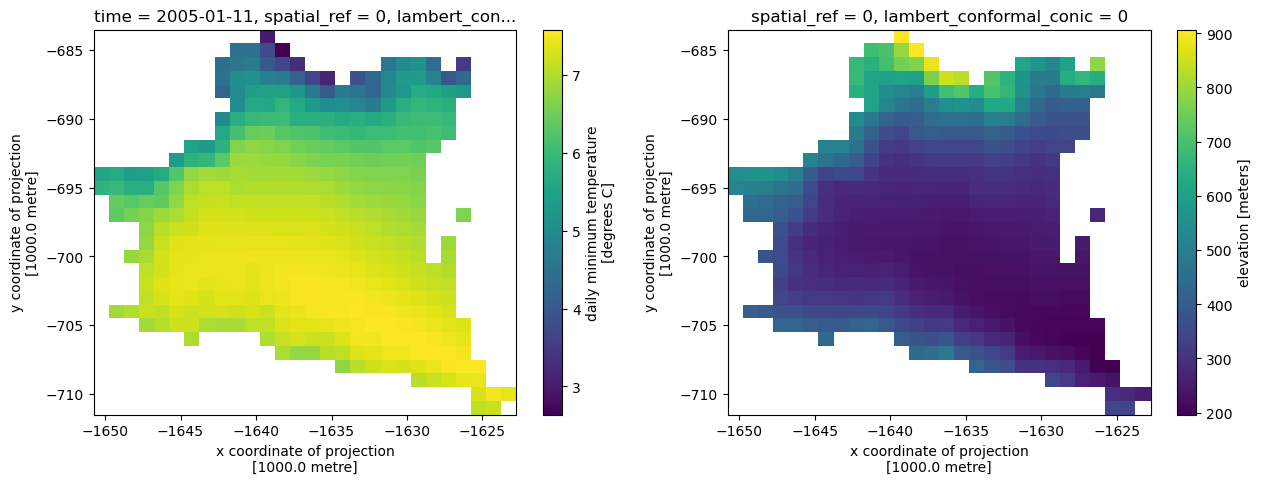
Additionally, we can get the elevations of set of x- and y- coordinates of a grid. For example, let’s get the minimum temperature data within the watershed from Daymet using PyDaymet then add the elevation as a new variable to the dataset:
[10]:
clm = daymet.get_bygeom(geometry, ("2005-01-01", "2005-01-31"), variables="tmin")
elev = py3dep.elevation_bygrid(clm.x.values, clm.y.values, clm.rio.crs, 1000)
attrs = clm.attrs
clm = xr.merge([clm, elev])
clm["elevation"] = clm.elevation.where(~np.isnan(clm.isel(time=0).tmin))
clm.attrs.update(attrs)
[11]:
fig, (ax1, ax2) = plt.subplots(nrows=1, ncols=2, figsize=(15, 5))
clm.tmin.isel(time=10).plot(ax=ax1)
clm.elevation.plot(ax=ax2)
[11]:
<matplotlib.collections.QuadMesh at 0x1b2e299d0>