<xarray.Dataset> Size: 259MB
Dimensions: (time: 3650, y: 37, x: 40)
Coordinates:
* time (time) datetime64[ns] 29kB 2006-01-01T12:00:00 ... 2015-12-31T...
* y (y) float32 148B 719.0 718.0 717.0 716.0 ... 685.0 684.0 683.0
* x (x) float32 160B 2.21e+03 2.211e+03 ... 2.248e+03 2.249e+03
Data variables:
dayl (time, y, x) float32 22MB dask.array<chunksize=(365, 37, 40), meta=np.ndarray>
lat (time, y, x) float64 43MB dask.array<chunksize=(365, 37, 40), meta=np.ndarray>
lon (time, y, x) float64 43MB dask.array<chunksize=(365, 37, 40), meta=np.ndarray>
prcp (time, y, x) float32 22MB dask.array<chunksize=(365, 37, 40), meta=np.ndarray>
srad (time, y, x) float32 22MB dask.array<chunksize=(365, 37, 40), meta=np.ndarray>
tmax (time, y, x) float32 22MB dask.array<chunksize=(365, 37, 40), meta=np.ndarray>
tmin (time, y, x) float32 22MB dask.array<chunksize=(365, 37, 40), meta=np.ndarray>
vp (time, y, x) float32 22MB dask.array<chunksize=(365, 37, 40), meta=np.ndarray>
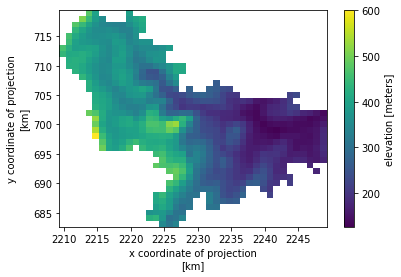
elevation (y, x) float64 12kB dask.array<chunksize=(37, 40), meta=np.ndarray>
pet (time, y, x) float64 43MB dask.array<chunksize=(365, 37, 40), meta=np.ndarray>
Attributes: (12/17)
start_year: 2006
source: Daymet Software Version 4.0
Version_software: Daymet Software Version 4.0
Version_data: Daymet Data Version 4.0
Conventions: CF-1.6
citation: Please see http://daymet.ornl.gov/ for current Dayme...
... ...
geospatial_lon_max: -69.13309404831536
crs: +proj=lcc +lat_1=25 +lat_2=60 +lat_0=42.5 +lon_0=-10...
nodatavals: 0.0
transform: [ 1.00000e+00 0.00000e+00 2.20625e+03 0.00000e+00...
res: [1. 1.]
bounds: [2209.24651856 682.07851575 2250.2123966 719.9719... Dimensions:
Coordinates: (3)
time
(time)
datetime64[ns]
2006-01-01T12:00:00 ... 2015-12-...
standard_name : time bounds : time_bnds long_name : 24-hour day based on local time _ChunkSizes : 1 _CoordinateAxisType : Time array(['2006-01-01T12:00:00.000000000', '2006-01-02T12:00:00.000000000',
'2006-01-03T12:00:00.000000000', ..., '2015-12-29T12:00:00.000000000',
'2015-12-30T12:00:00.000000000', '2015-12-31T12:00:00.000000000'],
dtype='datetime64[ns]') y
(y)
float32
719.0 718.0 717.0 ... 684.0 683.0
units : km long_name : y coordinate of projection standard_name : projection_y_coordinate array([719., 718., 717., 716., 715., 714., 713., 712., 711., 710., 709., 708.,
707., 706., 705., 704., 703., 702., 701., 700., 699., 698., 697., 696.,
695., 694., 693., 692., 691., 690., 689., 688., 687., 686., 685., 684.,
683.], dtype=float32) x
(x)
float32
2.21e+03 2.211e+03 ... 2.249e+03
units : km long_name : x coordinate of projection standard_name : projection_x_coordinate array([2209.75, 2210.75, 2211.75, 2212.75, 2213.75, 2214.75, 2215.75, 2216.75,
2217.75, 2218.75, 2219.75, 2220.75, 2221.75, 2222.75, 2223.75, 2224.75,
2225.75, 2226.75, 2227.75, 2228.75, 2229.75, 2230.75, 2231.75, 2232.75,
2233.75, 2234.75, 2235.75, 2236.75, 2237.75, 2238.75, 2239.75, 2240.75,
2241.75, 2242.75, 2243.75, 2244.75, 2245.75, 2246.75, 2247.75, 2248.75],
dtype=float32) Data variables: (10)
dayl
(time, y, x)
float32
dask.array<chunksize=(365, 37, 40), meta=np.ndarray>
long_name : daylength units : s/day grid_mapping : lambert_conformal_conic cell_methods : area: mean _ChunkSizes : [ 16777216 -402456576 -402456576] crs : epsg:4326 nodatavals : 0.0
Array
Chunk
Bytes
20.61 MiB
2.06 MiB
Shape
(3650, 37, 40)
(365, 37, 40)
Dask graph
10 chunks in 21 graph layers
Data type
float32 numpy.ndarray
40
37
3650
lat
(time, y, x)
float64
dask.array<chunksize=(365, 37, 40), meta=np.ndarray>
units : degrees_north long_name : latitude coordinate standard_name : latitude _CoordinateAxisType : Lat crs : epsg:4326 nodatavals : 0.0
Array
Chunk
Bytes
41.21 MiB
4.12 MiB
Shape
(3650, 37, 40)
(365, 37, 40)
Dask graph
10 chunks in 31 graph layers
Data type
float64 numpy.ndarray
40
37
3650
lon
(time, y, x)
float64
dask.array<chunksize=(365, 37, 40), meta=np.ndarray>
units : degrees_east long_name : longitude coordinate standard_name : longitude _CoordinateAxisType : Lon crs : epsg:4326 nodatavals : 0.0
Array
Chunk
Bytes
41.21 MiB
4.12 MiB
Shape
(3650, 37, 40)
(365, 37, 40)
Dask graph
10 chunks in 31 graph layers
Data type
float64 numpy.ndarray
40
37
3650
prcp
(time, y, x)
float32
dask.array<chunksize=(365, 37, 40), meta=np.ndarray>
long_name : daily total precipitation units : mm/day grid_mapping : lambert_conformal_conic cell_methods : area: mean time: sum _ChunkSizes : [ 16777216 -402456576 -402456576] crs : epsg:4326 nodatavals : 0.0
Array
Chunk
Bytes
20.61 MiB
2.06 MiB
Shape
(3650, 37, 40)
(365, 37, 40)
Dask graph
10 chunks in 21 graph layers
Data type
float32 numpy.ndarray
40
37
3650
srad
(time, y, x)
float32
dask.array<chunksize=(365, 37, 40), meta=np.ndarray>
long_name : daylight average incident shortwave radiation units : W/m2 grid_mapping : lambert_conformal_conic cell_methods : area: mean time: mean _ChunkSizes : [ 16777216 -402456576 -402456576] crs : epsg:4326 nodatavals : 0.0
Array
Chunk
Bytes
20.61 MiB
2.06 MiB
Shape
(3650, 37, 40)
(365, 37, 40)
Dask graph
10 chunks in 21 graph layers
Data type
float32 numpy.ndarray
40
37
3650
tmax
(time, y, x)
float32
dask.array<chunksize=(365, 37, 40), meta=np.ndarray>
long_name : daily maximum temperature units : degrees C grid_mapping : lambert_conformal_conic cell_methods : area: mean time: maximum _ChunkSizes : [ 16777216 -402456576 -402456576] crs : epsg:4326 nodatavals : 0.0
Array
Chunk
Bytes
20.61 MiB
2.06 MiB
Shape
(3650, 37, 40)
(365, 37, 40)
Dask graph
10 chunks in 21 graph layers
Data type
float32 numpy.ndarray
40
37
3650
tmin
(time, y, x)
float32
dask.array<chunksize=(365, 37, 40), meta=np.ndarray>
long_name : daily minimum temperature units : degrees C grid_mapping : lambert_conformal_conic cell_methods : area: mean time: minimum _ChunkSizes : [ 16777216 -402456576 -402456576] crs : epsg:4326 nodatavals : 0.0
Array
Chunk
Bytes
20.61 MiB
2.06 MiB
Shape
(3650, 37, 40)
(365, 37, 40)
Dask graph
10 chunks in 21 graph layers
Data type
float32 numpy.ndarray
40
37
3650
vp
(time, y, x)
float32
dask.array<chunksize=(365, 37, 40), meta=np.ndarray>
long_name : daily average vapor pressure units : Pa grid_mapping : lambert_conformal_conic cell_methods : area: mean time: mean _ChunkSizes : [ 16777216 -402456576 -402456576] crs : epsg:4326 nodatavals : 0.0
Array
Chunk
Bytes
20.61 MiB
2.06 MiB
Shape
(3650, 37, 40)
(365, 37, 40)
Dask graph
10 chunks in 21 graph layers
Data type
float32 numpy.ndarray
40
37
3650
elevation
(y, x)
float64
dask.array<chunksize=(37, 40), meta=np.ndarray>
units : meters crs : epsg:4326 nodatavals : 0.0
Array
Chunk
Bytes
11.56 kiB
11.56 kiB
Shape
(37, 40)
(37, 40)
Dask graph
1 chunks in 32 graph layers
Data type
float64 numpy.ndarray
40
37
pet
(time, y, x)
float64
dask.array<chunksize=(365, 37, 40), meta=np.ndarray>
units : mm/day crs : epsg:4326 nodatavals : 0.0
Array
Chunk
Bytes
41.21 MiB
4.12 MiB
Shape
(3650, 37, 40)
(365, 37, 40)
Dask graph
10 chunks in 21 graph layers
Data type
float64 numpy.ndarray
40
37
3650
Indexes: (3)
PandasIndex
PandasIndex(DatetimeIndex(['2006-01-01 12:00:00', '2006-01-02 12:00:00',
               '2006-01-03 12:00:00', '2006-01-04 12:00:00',
               '2006-01-05 12:00:00', '2006-01-06 12:00:00',
               '2006-01-07 12:00:00', '2006-01-08 12:00:00',
               '2006-01-09 12:00:00', '2006-01-10 12:00:00',
               ...
               '2015-12-22 12:00:00', '2015-12-23 12:00:00',
               '2015-12-24 12:00:00', '2015-12-25 12:00:00',
               '2015-12-26 12:00:00', '2015-12-27 12:00:00',
               '2015-12-28 12:00:00', '2015-12-29 12:00:00',
               '2015-12-30 12:00:00', '2015-12-31 12:00:00'],
dtype='datetime64[ns]', name='time', length=3650, freq=None)) PandasIndex
PandasIndex(Index([719.0, 718.0, 717.0, 716.0, 715.0, 714.0, 713.0, 712.0, 711.0, 710.0,
       709.0, 708.0, 707.0, 706.0, 705.0, 704.0, 703.0, 702.0, 701.0, 700.0,
       699.0, 698.0, 697.0, 696.0, 695.0, 694.0, 693.0, 692.0, 691.0, 690.0,
       689.0, 688.0, 687.0, 686.0, 685.0, 684.0, 683.0],
dtype='float32', name='y')) PandasIndex
PandasIndex(Index([2209.75, 2210.75, 2211.75, 2212.75, 2213.75, 2214.75, 2215.75, 2216.75,
       2217.75, 2218.75, 2219.75, 2220.75, 2221.75, 2222.75, 2223.75, 2224.75,
       2225.75, 2226.75, 2227.75, 2228.75, 2229.75, 2230.75, 2231.75, 2232.75,
       2233.75, 2234.75, 2235.75, 2236.75, 2237.75, 2238.75, 2239.75, 2240.75,
       2241.75, 2242.75, 2243.75, 2244.75, 2245.75, 2246.75, 2247.75, 2248.75],
      dtype='float32', name='x'))
Attributes: (17)
start_year : 2006 source : Daymet Software Version 4.0 Version_software : Daymet Software Version 4.0 Version_data : Daymet Data Version 4.0 Conventions : CF-1.6 citation : Please see http://daymet.ornl.gov/ for current Daymet data citation information references : Please see http://daymet.ornl.gov/ for current information on Daymet references History : Translated to CF-1.0 Conventions by Netcdf-Java CDM (CFGridWriter2)
Original Dataset = /daacftp/daymet/Daymet_Daily_V4/data/daymet_v4_daily_na_dayl_2006.nc; Translation Date = 2021-05-26T07:00:14.233Z geospatial_lat_min : 44.964817634118106 geospatial_lat_max : 45.5636129082089 geospatial_lon_min : -69.95790349094842 geospatial_lon_max : -69.13309404831536 crs : +proj=lcc +lat_1=25 +lat_2=60 +lat_0=42.5 +lon_0=-100 +x_0=0 +y_0=0 +ellps=WGS84 +units=km +no_defs nodatavals : 0.0 transform : [ 1.00000e+00 0.00000e+00 2.20625e+03 0.00000e+00 -1.00000e+00
7.29500e+02 0.00000e+00 0.00000e+00 1.00000e+00] res : [1. 1.] bounds : [2209.24651856 682.07851575 2250.2123966 719.97190299]