This page was generated from soil.ipynb.
Interactive online version:
![]()
Soil Storage Capacity#
[1]:
from __future__ import annotations

from pathlib import Path

import matplotlib.pyplot as plt
import numpy as np

import pygeohydro as gh
import pygeoutils as geoutils
from pynhd import NLDI
Some hydrological models have a parameter related the max soil storage capacity of watersheds. A simple way of estimating this parameter is to use porosity and thickness properties of a watershed soil. In this tutorial, we retrieve these data from two soil datasets that PyGeoHydro supports. PyGeoHydro has two functions for getting soil data:
soil_gnatsgo: You can access all soil properties that are available on gNATSGO datasetsoil_properties: Porosity, available water capacity, and field capacity properties are available through this function.
Let’s start by getting the basin geometry of the USGS station 11092450 using PyNHD:
[8]:
basin = NLDI().get_basins("11092450")
geom = basin.geometry.iloc[0]
Next, we get the soil porosity. Note that soil_properties return the requested property for the whole US. But, thanks to dask and xarray, the dataset is loaded lazily, so we don’t have to worry about memory usage. This function downloads the requested dataset(s) each of which is around 300 MB, so the first time that you run this function it can take a few minutes, depending on your internet speed. However, after it gets downloaded once, next calls to this function uses the downloaded
file, so it will be quick. By default, downloaded files are saved to ./cache folder, but you can specify a custom directory to save the zip files.
If you run this function without any arguments, it downloads all three soil properties and returns them as a single dataset. You can pass one or more of soil properties: por for porosity, awc for available water capacity, and fc for field capacity.
[3]:
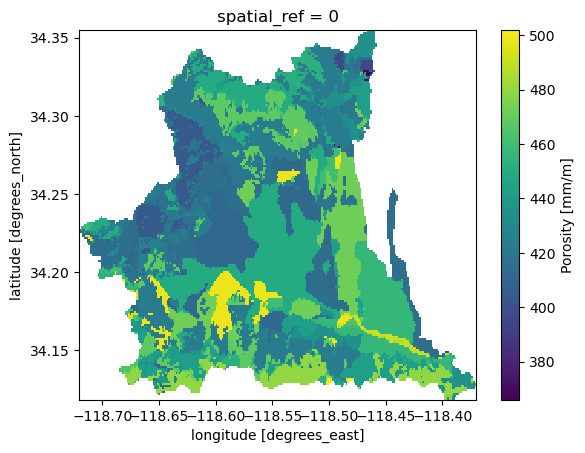
soil = gh.soil_properties("por")
Now, we can mask this large dataset to our basin geometry using PyGeoUtils.
[4]:
soil = geoutils.xarray_geomask(soil, geom, basin.crs)
soil = soil.where(soil.porosity > soil.porosity.rio.nodata)
soil["porosity"] = soil.porosity.rio.write_nodata(np.nan)
_ = soil.porosity.plot()
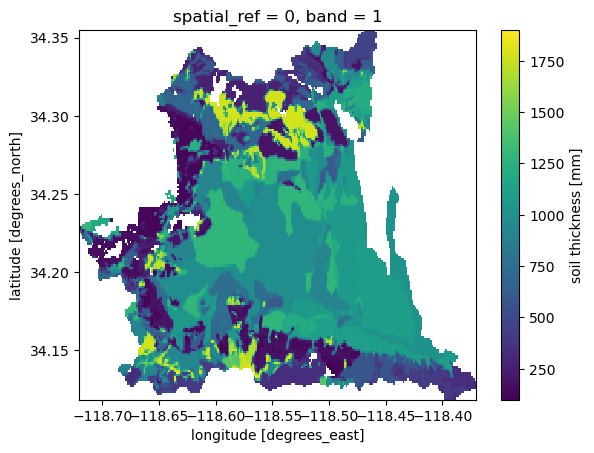
Now that we have the porosity, we need to get soil thickness. We use Microsoft’s Planetary Computer service using soil_gnatsgo function. This function has two additional dependencies that need to be installed: pystac-client and planetary-computer. They can be installed using conda or mamba as follows:
mamba -c conda-forge install pystac-client planetary-computer
We use tk0_999a later to get the total soil thickness. You can check out the full description the layer and other available layers from the dataset’s webpage. Also, we convert the thickness unit from cm to mm.
[5]:
thickness = gh.soil_gnatsgo("tk0_999a", geom, basin.crs).tk0_999a
thickness = thickness.where(thickness < 2e6, drop=False) * 10
thickness = thickness.rio.write_nodata(np.nan)
thickness.attrs["units"] = "mm"
thickness.attrs["long_name"] = "soil thickness"
thickness.name = "thickness"
Using thickness.rio.resolution() and soil.rio.resolution() we can see that the resolution of the thickness dataset is 10 m whereas that of the porosity is around 90 m. So, we should resample the dataset with finer resolution, thickness, to the coarser one. For this purpose we use rioxarray.reproject_match function. For resampling, we use the weighted averaging function of rasterio. Therefore, we need to 5 as the resampling method. The full list of supported resampling operations
can be found on rasterio webpage.
[6]:
soil["thickness"] = thickness.rio.reproject_match(soil, resampling=5)
_ = soil["thickness"].plot()
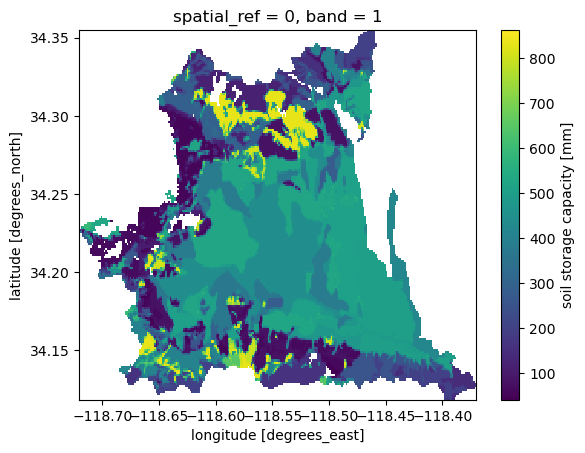
Considering that porosity is in mm/m and thickness is in mm, we can compute the storage capacity as follows:
[7]:
soil["storage"] = soil.porosity * soil.thickness * 1e-3
soil["storage"] = soil["storage"].rio.write_nodata(np.nan)
soil["storage"].attrs["units"] = "mm"
soil["storage"].attrs["long_name"] = "soil storage capacity"
soil["storage"].plot()
plt.savefig(Path("_static", "soil_storage.png"), dpi=150)