Data files from the STAC API
WaterDataSTAC queries the USGS Water Data STAC API, which lists data files: each item
describes one file, and its assets link to that file. It sends the key in
USGS_STAC_API_KEY, or in USGS_API_KEY when that is unset. This notebook lists the
collections, finds every file of the Potomac River gage, maps the sites of a basin,
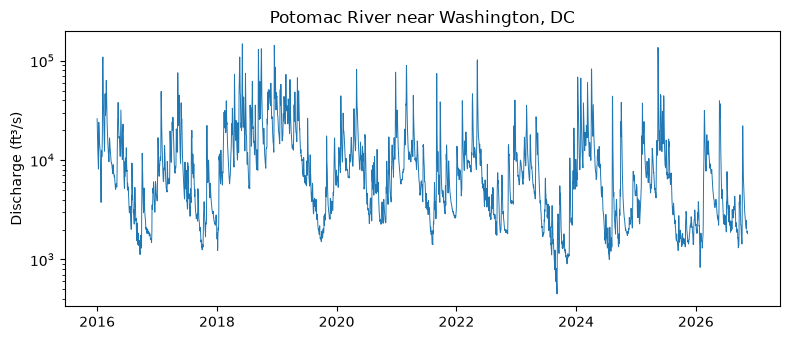
then downloads the gage's daily values and plots its discharge. to_arrow() turns a
result into a table for geopandas, which needs the arrow extra.
A service keeps its HTTP connections open until it is closed. In a script, use it in
a with block, with WaterDataSTAC() as stac:, which closes it on exit. A notebook
keeps one service across cells, so it calls stac.close() explicitly in its last cell.
Look at the collections
Each collection is one kind of file. queryables() lists the properties a query can
name; the items carry site metadata, not the parameters or periods inside the files.
for collection in stac.collections().collections or ():
    print(f"{collection.id:12} {collection.title}")
continuous   Continuous time series data
daily        Daily values time series data
ratings      USGS Stage Discharge Rating Curves
id, altitude, datetime, geometry, site_type, basin_code, state_code, state_name, agency_code, agency_name, county_code, county_name, aquifer_code, country_code, country_name, end_datetime, district_code, drainage_area, revision_note, site_type_code, start_datetime, vertical_datum, revision_created, altitude_accuracy, aquifer_type_code, construction_date, depth_source_code, revision_modified, vertical_datum_name, altitude_method_code, altitude_method_name, hydrologic_unit_code, national_aquifer_code, uses_daylight_savings, hole_constructed_depth, monitoring_location_id, time_zone_abbreviation, well_constructed_depth, monitoring_location_name, minor_civil_division_code, original_horizontal_datum, contributing_drainage_area, monitoring_location_number, horizontal_positional_accuracy, original_horizontal_datum_name, horizontal_position_method_code, horizontal_position_method_name, horizontal_positional_accuracy_code
Find one gage's files
ids with id_property matches items by site. A site list longer than 50 runs as
concurrent pieces, since the service refuses a long query URL. Each item's assets
name its files: continuous splits the last 150 days, current, from the older
historical values.
for collection in ("continuous", "daily", "ratings"):
    result = stac.collect(collection, ids=[SITE], id_property="monitoring_location_id")
    for item in result.geojson["features"]:
        print(f"{collection:11} {item['id']:24} {', '.join(item['assets'])}")
continuous  USGS-01646500            current, historical


daily       USGS-01646500            data


ratings     USGS-01646500.exsa.rdb   data
ratings     USGS-01646500.corr.rdb   data
ratings     USGS-01646500.base.rdb   data
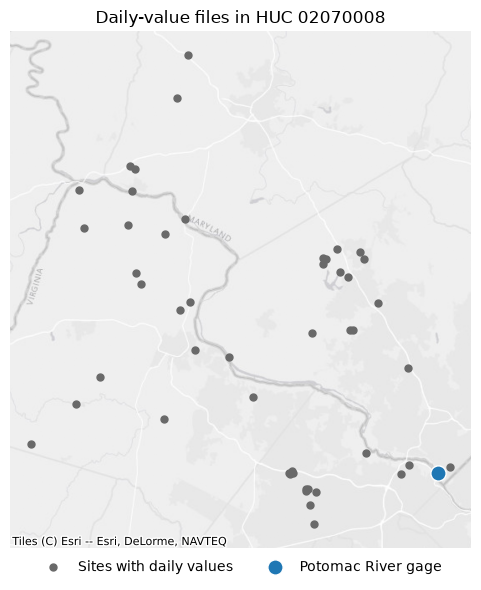
Map the sites of a basin
The items carry each site's hydrologic unit code, so a CQL2-Text LIKE selects a
basin by its prefix: here 02070008, the Middle Potomac-Catoctin.
import geopandas as gpd

basin = stac.collect("daily", filter="hydrologic_unit_code LIKE '02070008%'")
sites = gpd.GeoDataFrame.from_arrow(basin.to_arrow())
print(len(sites), "sites with daily values,", basin.pagination.completeness)
sites[["id", "monitoring_location_name", "site_type", "drainage_area"]].head()
50 sites with daily values, complete
| id | monitoring_location_name | site_type | drainage_area | |
|---|---|---|---|---|
| 0 | USGS-01636765 | POTOMAC RIVER AT BURKITTSVILLE RD AT BRUNSWICK... | Stream | 9453.00 |
| 1 | USGS-385655077112201 | MET STATION AT CHURCHILL ROAD PARK AT MCLEAN, VA | Atmosphere | NaN |
| 2 | USGS-0164578734 | SNAKEDEN BRANCH ABOVE LAKE AUDUBON AT RESTON, VA | Stream | 1.27 |
| 3 | USGS-385536077204401 | METEOROLOGICAL STN AT GLADE REC AREA AT RESTON... | Atmosphere | NaN |
| 4 | USGS-0164579522 | THE GLADE NEAR HOWLAND DRIVE AT RESTON, VA | Stream | 1.14 |
import contextily as ctx
import matplotlib.pyplot as plt
from xyzservices import providers

points = sites.to_crs(3857)
gage = points[points["id"] == SITE]
ax = points.plot(color="dimgray", markersize=25, figsize=(6, 6), label="Sites with daily values")
gage.plot(ax=ax, color="tab:blue", edgecolor="white", markersize=120, label="Potomac River gage")
ctx.add_basemap(ax, source=providers.Esri.WorldGrayCanvas)
ax.legend(loc="upper center", bbox_to_anchor=(0.5, 0), ncols=2, frameon=False)
ax.set(title="Daily-value files in HUC 02070008")
ax.set_axis_off()
plt.tight_layout()
Download and read the daily values
The asset files need no key. Client.download() fetches one to disk, creating its
folder. A download that carries a key counts against that key's hourly limit. The file
is Parquet, with each value stored as text.
import tempfile
from pathlib import Path

import polars as pl

from water_ogcapi import Client

item = stac.item("daily", SITE).body or {}
with Client() as client:
    path = Path(tempfile.mkdtemp()) / f"{SITE}.parquet"
    download = client.download(item["assets"]["data"]["href"], path)
print(f"{download.size:,} bytes")

daily = pl.read_parquet(path).with_columns(pl.col("value").cast(pl.Float64))
daily.group_by("parameter_code", "statistic_id").len().sort("len", descending=True)
848,638 bytes
| parameter_code | statistic_id | len |
|---|---|---|
| str | str | u32 |
| "00060" | "00003" | 35321 |
| "00010" | "00001" | 24663 |
| "00010" | "00002" | 24661 |
| "00010" | "00003" | 24652 |
| "00095" | "00002" | 12535 |
| … | … | … |
| "00300" | "00001" | 4299 |
| "00300" | "00003" | 4298 |
| "00400" | "00001" | 4268 |
| "00400" | "00002" | 4268 |
| "00400" | "00008" | 4267 |
Parameter 00060 with statistic 00003 is the daily mean discharge, in ft³/s.
flow = daily.filter(
    pl.col("parameter_code") == "00060",
    pl.col("statistic_id") == "00003",
    pl.col("time").dt.year() >= 2016,
).sort("time")
fig, ax = plt.subplots(figsize=(8, 3.5))
ax.plot(flow["time"], flow["value"], linewidth=0.7)
ax.set(yscale="log", ylabel="Discharge (ft³/s)", title="Potomac River near Washington, DC")
plt.tight_layout()
The two continuous files can be read the same way. If both hold a row for the same
time_series_id and time, keep the one with the latest last_modified.